We planted cold crops in our new raised beds today, using starters from our local garden resource program, Keep Growing Detroit, which for a nominal membership fee distributes transplants and seeds every growing season. Julia’s been watching their webinars and I’m playing catchup, just digging into (sorry) The Vegetable Gardener’s Bible. The other day, this single line from a section on garden tools struck me with its plain, clear-sighted truth:
A good tool allows you to exactly, not approximately, what you want to do.
A hammer’s job is to deliver a sharp impact, usually to the flat end of a nail, and it does that job exactly. A garden trowel is meant for shallow digging – creating the exact divot you need to drop in a lettuce transplant. A flat, hefty rock could do both of these jobs, but without the accuracy or precision of either, and thus can’t be considered a good tool for them. Adequate, perhaps, but not good.
What, then, of a smartphone? Or a computer? Maybe it’s better not to think of these as tools themselves but toolboxes – or maybe toolkits, like those 76-piece sets for making general repairs around the house; the tools are the software inside. And these software tools, like all tools, remain inert until used with purpose. Only then can you evaluate whether they accomplish that purpose exactly.
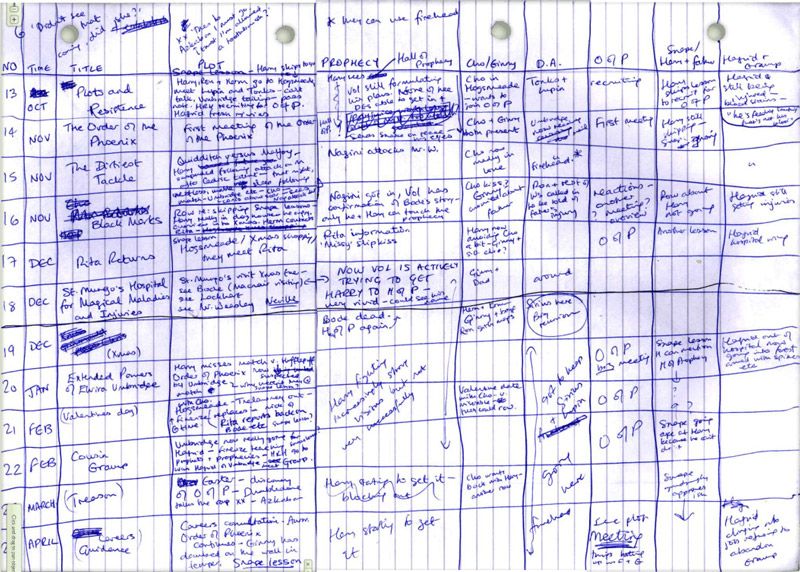
No diatribe here lamenting the downsides of having an infinite toolkit (I’ve already written plenty of those); I’m at this moment more interested in the inertness – or to use another word, potential. I’ve been re-outlining the new manuscript, in order to get my bearings for the next draft, and I remembered the handwritten story chart that J.K. Rowling made for Order of the Phoenix:
With a bit more digging (sorry) I came across this much larger – and quite insane – chart that Joseph Heller made for Catch-22:
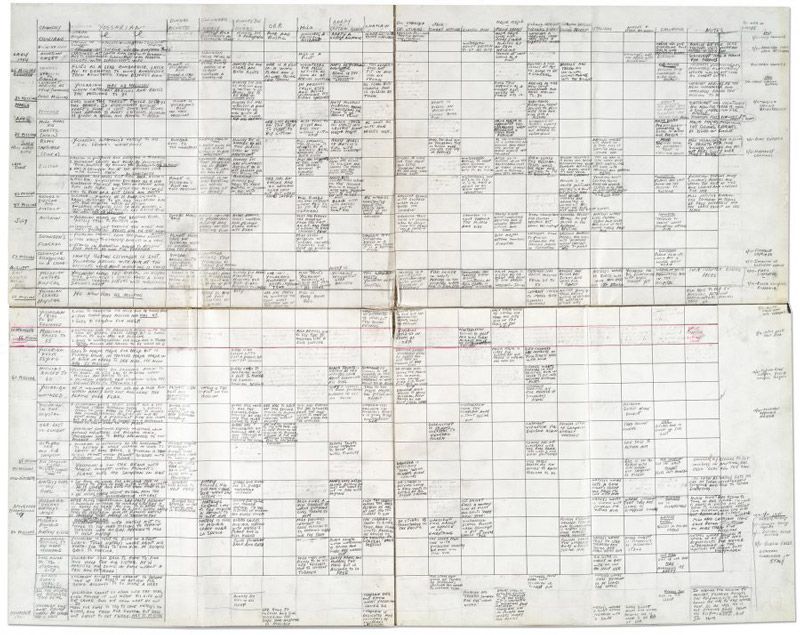
Both are spreadsheets, with time/scene running down the rows and characters and relationships running crosswise. I’d never found charts or outlines like these compelling, or even very comprehensible before; they didn’t fit the way that I wrote. When I tried to plot out my stories ahead of writing them, the scenes that resulted would feel too stilted. For this purpose, for this author, a story chart – or plot spreadsheet or whatever you wish to call it – was a poor tool.
But on a whim I decided to give the chart another try this weekend, and as I populate it with what’s in my second draft, I’m finding it a good degree more useful than before. The reason, I think, is because my new chart isn’t a map of things I haven’t written yet but a map of things I already have. It lets me see the gaps, the still-enshrouded lands, and also which scenes I may be able to cut and merge with others.
Maybe it’s a factor of experience – you start out with Photos.app and graduate to Lightroom; the same tool that does exactly what a beginner wants might be woefully inadequate for the professional. But I think it’s also that with expertise comes a sharper sense of purpose. That for the story chart to be exact – a good tool – I first had to have written enough to know exactly what I wanted it to do.
Maybe one day I’ll be the kind of writer that actually uses Scrivener. Or maybe not.
